


The Primetime Emmy awards, usually dubbed ‘the TV Oscars’, is a popular TV event that awards the best shows on television. At Zapr, we analyzed the show's TV viewership and found some interesting insights.
From an industry perspective, Primetime Emmy Awards provides insights into popular and trending TV content. At Zapr, we dived into viewership for this live TV event and analyzed the audiences who tuned in to see how well their favorite shows performed. Who were these viewers? Is there a way to reach this niche English audience with relevant promos for upcoming shows on TV and OTT?
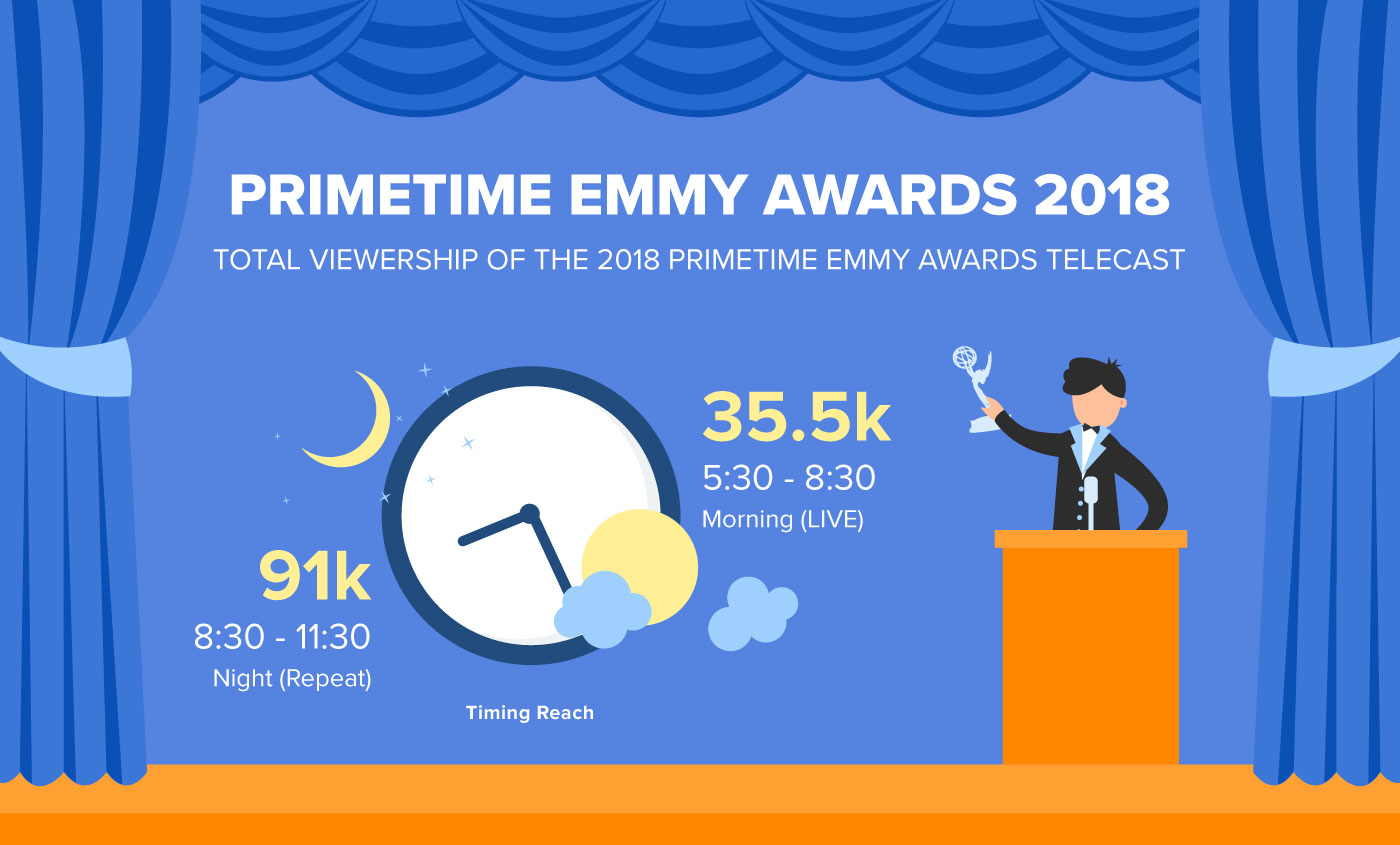
How many tuned in to watch the event?
Broadcasted on Star World India, the morning (LIVE) telecast of the awards event reached 35.5k viewers while the night (repeat) telecast saw the numbers almost tripling, with 91k viewers tuning in, which is hardly surprising, owing to the Primetime rush hour.
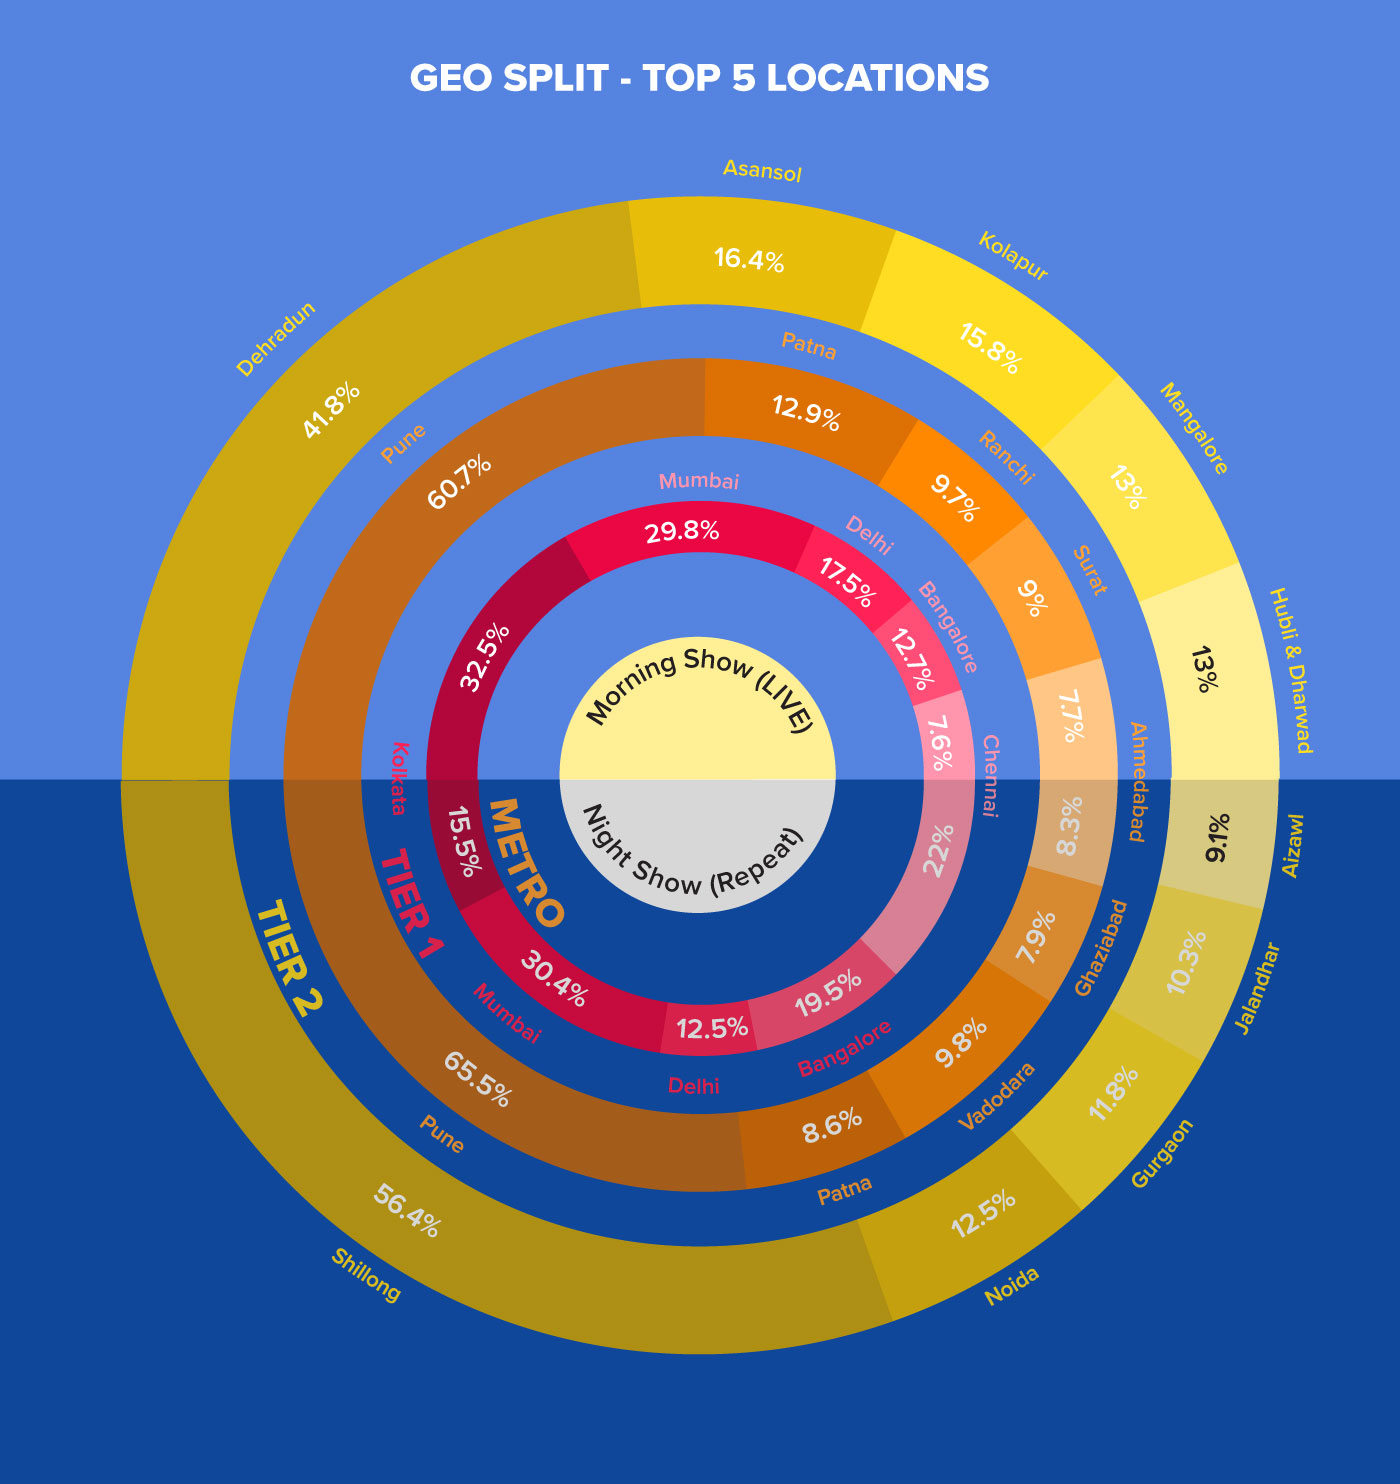
Geographical split among urban audiences (Top 5 cities)
We mapped out viewers by geography to see how different parts of India watched the awards show. Our analysis of viewership across the top 5 geographical locations gave us interesting insights on region-wise content preferences. We found that for the LIVE telecast, among the top 5 metro cities, Kolkata garnered the highest viewership share at 32.5%. Within the Tier 1 cities, Pune amassed a majority 60.7% share while Dehradun garnered 41.8% of the viewership share among Tier 2 audiences.
As for the repeat (night) telecast aired during Primetime, Mumbai garnered a 30.4% share of viewership among the top 5 metro cities with Pune and Shillong recording 65.5% and 56.4% of the total share among Tier 1 and Tier 2 top 5 cities respectively. The data showed that the metros had better reach with viewership share spread across the cities, while viewership in Tier 1 and Tier 2 cities were concentrated in specific locations.
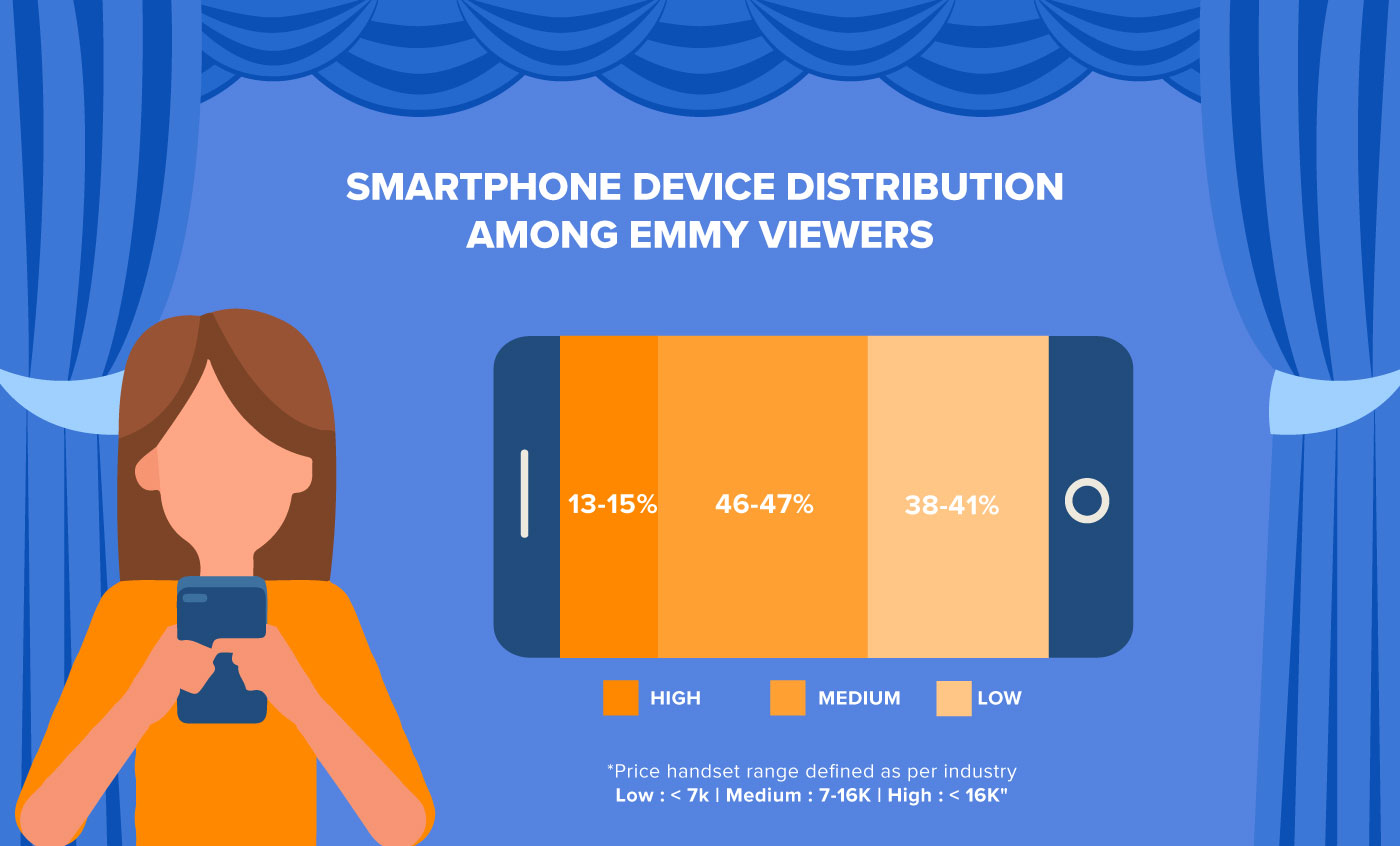
Audiences and their spending capacity: Majority users with above average spending power
Analyzing the smartphone devices used by Emmy’s audiences, we found that 62% owned mid-to-high range smartphones, indicating that the majority were individuals with above average spending power.
Get deeper insights and reach English audiences with relevant show promos
At Zapr, we can delve deeper and get highly granular data that gives insights on city-wise viewership, reach and audience purchase power. Moreover, we can help you reach them with promos of upcoming shows and episodes which they are most likely to find interesting. Target TV viewers on their mobiles anywhere, anytime and get their attention to where you want. Know more about our offerings here.
Read how India watched The Golden Globe Awards 2018.
