
Every quarter, hundreds of different brands advertise on TV across various categories. For a long time now, brands have struggled to measure the effectiveness of their TV campaigns. This made it hard to compare their performance with other competing brands in the same category.
On a mission to solve this problem for the advertising industry, Zapr came up with a solution earlier this year. Leveraging our cutting edge tech, AI and big data tools, we launched a ranking methodology that can provide meaningful insights every quarter – The Zapr Index.
Essentially, the Zapr Index is a score that measures the effectiveness of brand TV campaigns within its product category. The quarterly index is built on a unique model that looks at both standard (ones that conventional research panels cover) and previously unexplored factors for TV ad measurement, such as coverage, concentration, competitive edge and cost effectiveness. Together, we call this the ‘4C Model’.
How do we get this data?
Using disruptive AI technology, we analyze all TV commercials that air every quarter, based on Zapr’s media repository of over 300+ channels, >30,000 TV commercials across an audience of over 70 million individuals. We further deep-dive into key metrics and equip brands with actionable insights on how to optimize their media planning strategy.
What is the 4C Model?
To comprehensively assess the effectiveness of brand TV campaigns, we look at the following 4 key aspects of TV ads:
- Coverage
This parameter measures how many people your brand reached out to. What percentage of your target audience did your ad reach across markets? How well spread was the TVC reach among your audience? How aware of your brand are your TV audiences? - Concentration
It measures if a particular brand has built high ad frequency for optimal exposure. Did your target audience watch the ads enough times to be able to recall the brand? How evenly spread was the frequency of the ad across all the cities in its target market? - Competitive Edge
As the term suggests, it looks at how your brand is faring compared to your competitors. What is your share of voice with relation to your competition within your category? How exclusive is your audience to your brand? - Cost Effectiveness
The cost index metric looks at how much value has been derived by your brand compared to your competitors. What’s the ROI rate generated by your brand’s commercials? How many impressions were delivered for each rupee spent on TV?
While the first three Cs are output factors as they show how well the commercials performed, cost effectiveness is an input factor as it indicates how much was spent on the TV campaign. It is based on standard industry rates and ignores any special discounts which certain brands may enjoy. For this reason, we have the performance index score.
The Performance Index
Given that the costs incurred for a campaign is confidential to the brand, ‘Performance Index’ measures the effectiveness of TV campaigns using only the output factors and excludes the cost effectiveness parameter from the brand’s final score. It becomes a sub-metric to measure brand TV campaign effectiveness. Moreover, it acts as a tie-breaker when two brands have the same Zapr Brand Index scores.
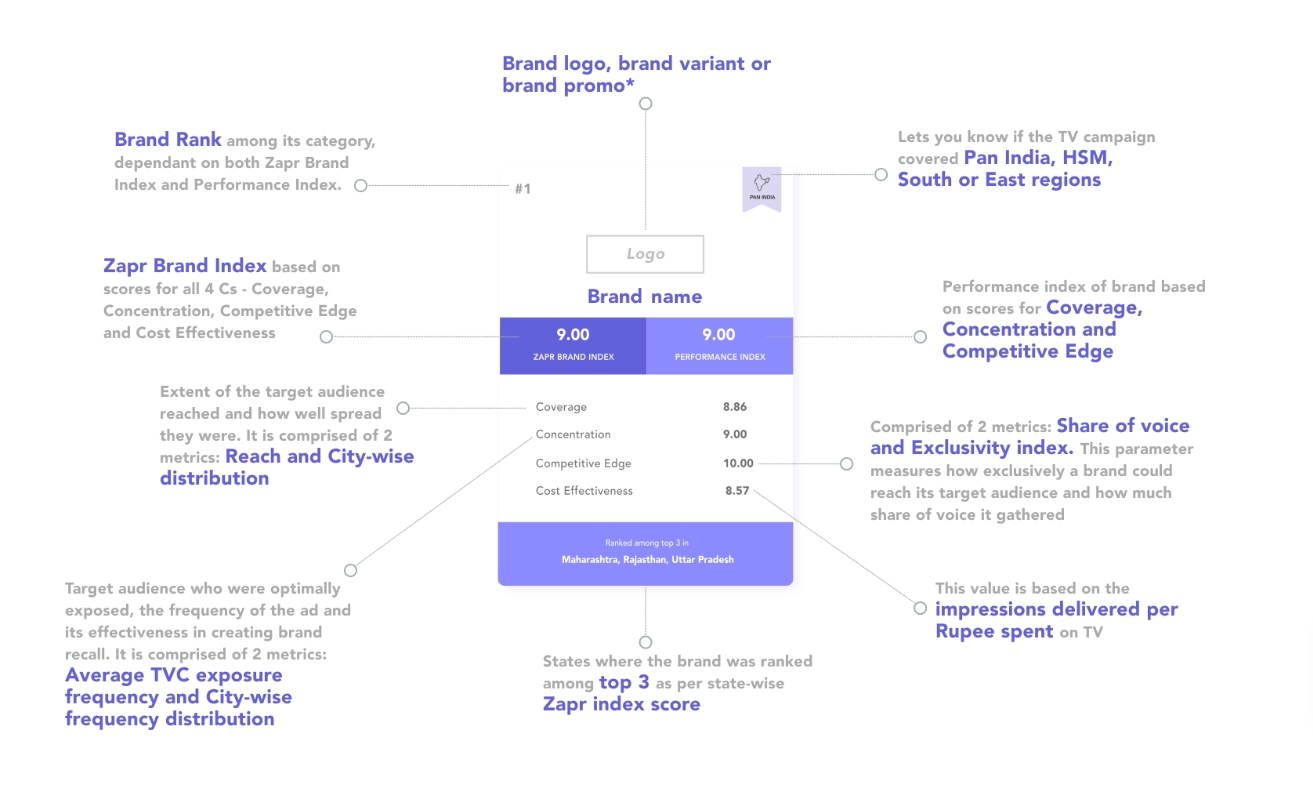
The weightage of every parameter under each ‘C’ is arrived at through statistical analysis and initial industry feedback. You can read up more on our methodology here. Below is a quick guide to reading the score cards in the index:
The Zapr Index is now digital!
For our third and latest release, The Zapr Index | Q1 FY 2020 - Summer Quarter, we decided to drop print, and instead go green and go live. The Zapr Index is now online and just a click away — https://index.zapr.in.
Our most recent report looks at TV ads aired during 1st April - 29th June 2019, where we’ve covered nearly a hundred prominent categories with at least five brand in it advertising during the quarter.
While the brand categories are mentioned as defined by industry standards, we have clubbed similar categories together into one, especially where the number of brands advertising aren’t many. A list of all the categories featured can be found here.

The Zapr Index will be updated every quarter to tell brands how their TV ads have performed compared to their competitors. And this is just a bite of the full scope of insights our massive data has got to offer.
We’ve already started working with other brands on directly impacting their bottom-lines by making their TV media plans more effective. If you’re a brand that advertises on TV, we’ll be more than happy to discuss optimizing your TV campaign plans further with you.
Feel free to reach out to us if you have any questions regarding the index and what Zapr has to offer. And watch out for the current quarter’s report on The Zapr Index.